Accounts
accounts.RmdManual download of account lists from github
If you would like to access or download the account seed lists without using R, you can directly load them via the following links:
Russian diplomat Twitter accounts and labelling browsable table or raw csv file
Chinese diplomat Twitter accounts and labelling browsable table or raw csv file
R functions to pull diplomat account and labelling data
options(tidyverse.quiet = TRUE)
library(tidyverse)
library(disinfo)
# remotes::install_github("hrbrmstr/waffle")
library(waffle)
library(extrafont)
library(emojifont)
# load.fontawesome()
# load.fontawesome(font = "fontawesome-webfont.ttf")
loadfonts(device = "win", quiet = TRUE)
loadfonts(device = "pdf", quiet = TRUE)
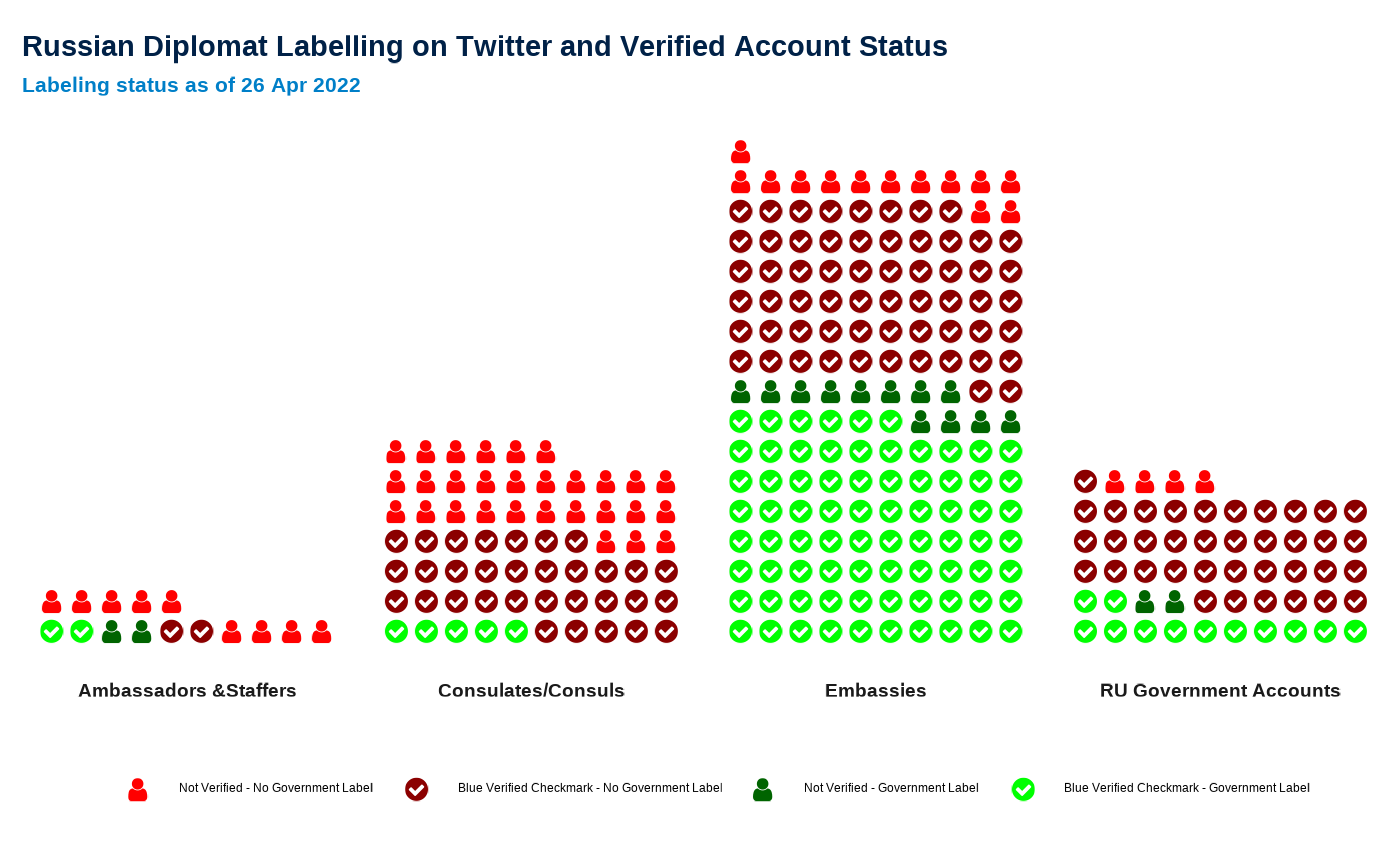
ru_accs <- get_accounts(country = "RU",group = "diplomats")## [1] "321 Russian diplomats and government accounts. Twitter transparency labels as of 2022-04-26. Account data as of 2022-04-26."
ru_accs %>%
  group_by(cat) %>%
  mutate(n_cat = n()) %>%
  group_by(cat,n_cat,gov_label = gov_label != "") %>%
  summarise(n = n()) %>%
  mutate(perc = n/n_cat) %>% filter(gov_label == T)
## # A tibble: 6 x 5
## # Groups: cat, n_cat [6]
## cat n_cat gov_label n perc
## <chr> <int> <lgl> <int> <dbl>
## 1 A 7 TRUE 1 0.143
## 2 C 66 TRUE 5 0.0758
## 3 E 161 TRUE 88 0.547
## 4 G 55 TRUE 14 0.255
## 5 QG 11 TRUE 1 0.0909
## 6 S 8 TRUE 3 0.375
veridata <-
  ru_accs %>%
  group_by(cat) %>%
  mutate(n_grp = n()) %>%
  group_by(cat,n_grp,govlab = !is.na(gov_label)) %>%
  mutate(n_lab = n()) %>%
  mutate(perc = n_lab/n_grp) %>%
  group_by(cat,n_grp,govlab ,veri = verified != F,n_lab,perc) %>%
  summarise(n = n()) %>%
  mutate(perc_veri = n/n_lab)

veridata$comb <- interaction(veridata$veri,veridata$govlab)

veridata <-
  veridata %>%
  group_by(cat) %>%
  arrange(desc(comb))

veridata$lab <- NA
veridata$lab[veridata$cat == "A"] <- "Ambassadors &Staffers"
veridata$lab[veridata$cat == "C"] <- "Consulates/Consuls"
veridata$lab[veridata$cat == "S"] <- "Ambassadors &Staffers"
veridata$lab[veridata$cat == "G"] <- "RU Government Accounts"
veridata$lab[veridata$cat == "E"] <- "Embassies"
veridata$lab[veridata$cat == "QG"] <- NA # exclude "Quasi-Gov"
gg3 <-
  ggplot(veridata %>% filter(!is.na(lab))) +
  geom_pictogram(
    aes(colour = comb,label = comb ,values = n),
    n_rows = 10, size = 7,  flip = TRUE,
    family = "fontawesome-webfont"
  ) +
  scale_color_manual(name = NULL,
                     values = c("red","darkred","darkgreen","green"),
                     labels = c("Not Verified - No Government Label   ",
                                "Blue Verified Checkmark - No Government Label   ",
                                "Not Verified - Government Label   ",
                                "Blue Verified Checkmark - Government Label   ")
  )+
  scale_label_pictogram(
    name = NULL,
    values = c("user","check-circle","user","check-circle"),
    labels = c("Not Verified - No Government Label   ",
               "Blue Verified Checkmark - No Government Label   ",
               "Not Verified - Government Label   ",
               "Blue Verified Checkmark - Government Label   ")
  ) +
  coord_equal() +
  facet_wrap(~ lab, scales = "fixed",nrow = 1,
             #  space = 'free',
             drop = T,
             strip.position = "bottom") +

  labs(x = NULL,y = NULL,
       title = "Russian Diplomat Labelling on Twitter and Verified Account Status",
       subtitle = paste0("Labeling status as of ",format(unique(ru_accs$labels_scraped),"%d %b %Y")))+
  theme_minimal()+
  theme(legend.position = "right",
        plot.title = ggplot2::element_text(family="Arial",
                                           size=22,
                                           face="bold",
                                           color = "#002147"),
        plot.subtitle = ggplot2::element_text(family="Arial",
                                              size=16,
                                              face = "bold",
                                              color= "#007fc8",#oxblue,
                                              margin=ggplot2::margin(0,0,5,0)),
        plot.caption = ggplot2::element_blank()) +
  theme(axis.ticks.x = element_blank(),
        axis.text.x = element_blank(),
        axis.ticks.y = element_blank(),
        axis.text.y = element_blank(),
        panel.grid.minor.y = element_blank(),
        panel.grid.major.y = element_blank(),

        panel.grid.major.x = element_blank(),
        panel.grid.minor.x = element_blank(),
        strip.text = element_text(size = 14,family = "Roboto",face = "bold"),
        legend.position = "bottom") #+


gg3